Re-epithelialisation, preventing microbial growth and reducing pain are the main concerns in the treatment of wounds. Postoperative wound infections delay wound healing in laparotomies, especially in cases with perforated appendicitis, peptic ulcer perforation, traumatic intestinal/colonic perforations, severe peritonitis and intra-abdominal infection that require resection/anastomosis of the intestinal structure. Even in clean wounds, such as with diagnostic laparotomy where there is no contact with intestinal structures, postoperative wound infections and delayed wound healing can be a cause of morbidity and even mortality. Older care patients who are bedbound, patients with diabetes, patients with AIDS, patients undergoing radiotherapy/chemotherapy and people with haematological diseases, such as aplastic anaemia, are particularly vulnerable to wound infection and delayed wound healing. This prolongs hospital stay, delays recovery and incurs additional costs.1
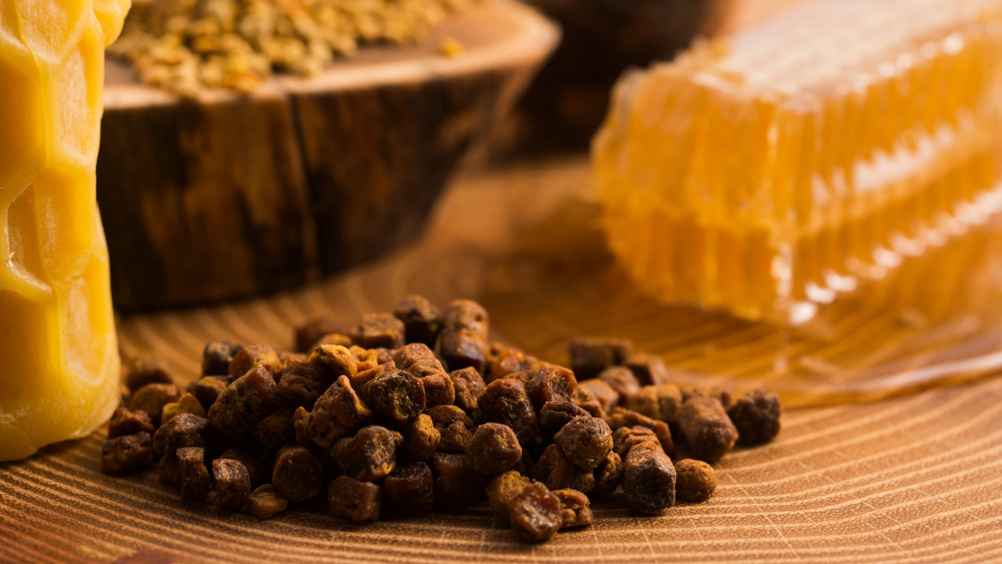
Throughout history, herbal and animal products or their derivatives have been used for medical purposes in the treatment of various diseases and wounds. Propolis, which is produced by bees, is one such product. It has epithelial, analgesic, antibacterial, antifungal and antiviral effects2 with no reported side-effects. It has been reported that microbial resistance does not develop against propolis.3
The nucleolus has an important role in ribosomal biogenesis and process, cellular proliferation and cell growth.4 Size, morphology and components of the nucleolus are related to both nucleolar and cellular activity. Various nucleolar proteins are localised in specific nucleolar compartments to constitute a functional nucleolus.5 When the nucleolus or nucleolar precursor body is activated, the nucleolus consists of the innermost fibrillar centres (FCs) surrounded by dense fibrillar components (DFCs), which are bordered by granular components (GCs) such as RNA polymerase I (RNA Pol I) and upstream binding transcription factors (UBTF), which are ribosomal DNA (rDNA) transcriptional enzymes present in FCs. Nucleolin (NCL) and nucleophosmin (NPM1) are associated with the processing of premature ribosomal RNA (rRNA) and placed in GCs.6 The nucleolus is an ideal location for the fine regulation of cell homeostasis and plays a crucial role in sensing diverse stresses such as genotoxic and oxidative stress, nutrient deprivation, heat shock, oncogene activation and viral infection.7
To the best of our knowledge, no studies of expression levels and function of NCL, NPM1 and UBTF in experimental clean and clean–contaminated laparotomy wound models (applied with or without propolis and fusidic acid which is known as a local antibiotic widely used in wound treatment) were detected in the literature. In this study, we aimed to evaluate NCL, NPM1 and UBTF gene expression levels as an indicator of proliferation, viability and metabolic activities of the cells, in addition to whether propolis has benefits in wound healing and in preventing wound infections. The objective was to provide novel understanding of the putative role of these proteins in wound healing.
Materials and methods
Animals
Animals were provided by Duzce University Experimental Animal Application and Research Center. A total of 56 female Wistar rats, weighing 200–300g, were randomly divided into seven equal groups (n=8). All surgical procedures and postoperative care were performed in compliance with the National Institute of Health guidelines for the Care and Use of Laboratory Animals. Duzce University Experimental Animals Local Ethics Committee approved the study (certificate dated 05.05.2020 and numbered 2020/05/01).
Experimental design
This experimental study was planned by creating clean and clean–contaminated wounds according to the surgical wounds classification.8 Animals were divided into seven groups: control; laparotomy; anastomosis; fusidic acid (with or without anastomosis); and propolis (with or without anastomosis). No surgical procedure or drug therapy was used in the control group. Following anaesthetisation with intraperitoneal ketamine hydrochloride, 90 mg/kg (Ketalar, Pfizer, US) and xylazine hydrochloride 10mg/kg (Rompun, Bayer, Germany), the animals were euthanised, and blood and tissue samples were taken.
- In the laparotomy group, only a median laparotomy incision was made without anastomosis under anaesthesia, and no medication was applied
- In the anastomosis group, anastomosis was performed with laparotomy under anaesthesia and no medication was applied afterwards. The anastomosis was performed as follows: after cutting the colon distal to the caecum in full-thickness, anastomosis was achieved by suturing with 6/0 vicryl. The peritoneum, muscles and skin were closed with 3/0 silk as a full layer
- In the A(–) fusidic acid group, only a laparotomy incision was made without anastomosis under anaesthesia, and a local fusidic acid ointment (Fucidin 2%, Abdi Ibrahi, Turkey) was applied twice a day for five days on the surface of the incision
- In the A(+) fusidic acid group, anastomosis was performed with laparotomy under anaesthesia, and a fusidic acid ointment was applied locally twice a day for five days on the surface of the incision
- In the A(–) propolis group, only a laparotomy incision was made without anastomosis under anaesthesia, and a propolis solution (propolis 20% solution (EEP)) was applied locally twice a day for five days on the surface of the incision
- In the A(+) propolis group, anastomosis was performed with laparotomy under anaesthesia, and a local propolis 20% solution, EEP was applied twice a day for five days on the surface of the incision
- In the control group, no surgical procedure or drug therapy was used.
Detection of blood parameters
A haemogram was undertaken. Markers of wound infection including: white blood cell (WBC) distribution; lymphocyte% and lymphocyte count; monocyte% and monocyte count; neutrophil% and neutrophil count; eosinophil% and eosinophil count; basophil% and basophil count were measured by Mindray BC-5000 Vet Auto Hematology Analyser (Mindray Bio-Medical Electronics Co., Ltd., China).
Tissue collection
At the end of day 5, after the rats were euthanised, blood samples taken from the heart, were fixed with formaldehyde. Blood markers were examined. NCL, NPM1 and UBTF gene expressions, (important nucleolus organiser region (NOR) proteins) in the tissue samples) were also evaluated.
RNA isolation and complementary DNA (cDNA) synthesis
RNA was isolated from the incision site skin and intestinal tissue of the anastomosis site using RiboEx (Catalog No: 301-001) and Hybrid-R (Catalog No: 305-101) isolation kits (GeneAll Biotechnology, Korea) according to the manufacturer's instructions. Measurements were made in a spectrophotometer to evaluate the suitability of the RNA quality for the study. Using the HyperScript First Strand cDNA synthesis kit (Catalog No: 601-005) (Invitrogen, US), cDNA was obtained from isolated RNA.
Relative gene expressions of nucleolin, nucleophosmin and UBTF by real-time quantitative polymerase chain reaction (qPCR)
Primers were used for the detection of related gene expression levels (Table 1).
Table 1. Primers used for the detection of related genes expression levels
Gene name | Primers | Manufacturer |
---|---|---|
NCL-F | AAAAGGCTGCAGTTCCCACA | Invitrogen, US |
NCL-R | TTTTGCTTGTGCAGCTCCCT | Invitrogen, US |
NPM1-F | CAGTTTAGGAGCAGGGGCAA | Invitrogen, US |
NPM1-R | CCCCAAGGGAAACTGTTGGT | Invitrogen, US |
UBTF-F | GCTTTGTCTGGAGACTCGCT | Invitrogen, US |
UBTF-R | CGTGTGGGTGCTAGTAAGGG | Invitrogen, US |
GAPDH-F | AGTGCCAGCCTCGTCTCATA | Invitrogen, US |
GAPDH-R | GGTAACCAGGCGTCCGATAC | Invitrogen, US |
NCL-F—nucleolin-forward; NCL-R—nucleolin-reverse; NPM1-F—nucleophosmin-forward; NPM1-R—nucleophosmin-reverse; NPM1-R—nucleophosmin-forward; UBTF-F—upstream binding transcription factor-forward; UBTF-R—upstream binding transcription factor-reverse; GAPDG-F—glyceraldehyde 3-phosphate dehydrogenase-forward; GAPDG-F—glyceraldehyde 3-phosphate dehydrogenase-reverse
For each cDNA sample, expression levels of NCL, NPM1, UBTF and the enzyme used for internal control (glyceraldehyde 3-phosphate dehydrogenase, GAPDH) were analysed using the Applied Biosystems 7500 Fast Real-Time PCR instrument (ThermoFisher, US).
Polymerase chain reactions (PCRs) in a final volume of 20µL: 4µL cDNA, 3µL RNase-free distilled water, 10µL 2X RealAmpTM SYBR qPCR Master mix (Catolog No: 801-051) (Invitrogen, US), 1µL ROX Dye and 10µL primer–probe set (Invitrogen, US).
Cycle conditions of the real-time qPCR were:
- Initial denaturation at 95°C for 300 seconds
- 40 cycles of denaturation at 95°C for 15 seconds
- 40 cycles of annealing at 60°C for 60 seconds.
GAPDH transcription is used as a reference for the quantification of mRNA expressions and normalised according to the control group. Calculation of fold change was made by processing ΔΔCt values as 2-ΔΔCt.
Statistical analysis
Data were evaluated using the Statistical Package for Social Sciences (SPSS, IBM Corp., US) for Windows 22.0. (Microsoft Corp., US). The normality assumption for the continuous variables was analysed by Shapiro–Wilk test quality. Since the data were not normally distributed (p<0.05), non−parametric tests were used for statistical analysis. In addition to descriptive statistics for each variable (number, mean, standard deviation (SD), median and interquartile range), the Kruskal–Wallis test was used for each group comparison. Statistical differences were tested using Dunn's post hoc test. Polynomial regression test was also performed. A p-value of <0.05 was accepted as statistically significant.
Results
Results are provided in the following tables:
- Table 2: the mean NCL, NPM1 and UBTF values of each group. When all the groups were considered, statistically significant differences among the groups were detected for NCL, NPM1 and UBTF. In order to understand the differences that were caused from each group, comparison of the groups was performed.
- Table 3: results of binary comparison of the groups for NCL, NPM1 and UBTF (numbers in bold show those with a statistically significant difference between these groups)
- Table 4: results of the double comparison of the groups for haemogram parameters (how those with a statistically significant difference between these groups for each element of the haemogram)
- Table 5: a model summary and parameter estimates for expression levels of NCL, NPM1 and UBTF
Table 2. The mean±standard deviation (SD) nucleolin (NCL), nucleophosmin (NPM1), and upstream binding transcription factor (UBTF) values for all groups. Each group contains 8 animals.
Grps | NCL (n=8) | Mean±SD NCL of group/median (range) (n=56) | NPM1 (n=8) | Mean±SD NPM1 of group/median (range) (n=56) | UBTF (n=8) | Mean±SD UBTF of group/median (range) (n=56) | χ2 | p |
---|---|---|---|---|---|---|---|---|
C1 | 1.29 | 1.093±0.456/1.038 (1.074) | 1.173 | 1.109±0.559/0.935 (1.317) | 1.979 | 1.386±1.053/1.216 (2.283) | ||
C2 | 0.786 | 0.634 | 0.424 | |||||
C3 | 1.652 | 1.931 | 0.442 | |||||
C4 | 0.598 | 0.697 | 2.697 | |||||
C5 | 1.39 | 1.183 | 1.989 | 19.022* | 0.004* | |||
C6 | 0.776 | 0.624 | 0.414 | |||||
C7 | 1.662 | 1.941 | 0.452 | |||||
C8 | 0.588 | 0.687 | 2.687 | |||||
L1 | 2.373 | 1.806±0.667/2.016 (1.574) | 0.887 | 0.678±0.403/0.683 (0.990) | 15.44 | 11.297±5.985/11.805 (13.998) | ||
L2 | 0.819 | 0.188 | 17.78 | |||||
L3 | 2.29 | 0.468 | 8.16 | |||||
L4 | 1.741 | 1.168 | 3.8 | |||||
L5 | 2.383 | 0.897 | 15.45 | |||||
L6 | 0.809 | 0.178 | 17.778 | |||||
L7 | 2.3 | 0.478 | 8.17 | |||||
L8 | 1.731 | 1.158 | 3.79 | |||||
A1 | 1.719 | 1.345±0.31/1.353 (0.784) | 1.546 | 1.119±0.309/1.067 (0.769) | 3.262 | 4.253±1.987/3.472 (4.761) | ||
A2 | 1.224 | 0.939 | 7.415 | |||||
A3 | 0.945 | 1.194 | 3.672 | |||||
A4 | 1.492 | 0.797 | 2.664 | |||||
A5 | 1.729 | 1.556 | 3.272 | 16.490† | 0.011† | |||
A6 | 1.214 | 0.929 | 7.405 | |||||
A7 | 0.955 | 1.204 | 3.682 | |||||
A8 | 1.482 | 0.787 | 2.654 | |||||
A–F1 | 1.215 | 1.253±0.229/1.328 (0.537) | 1.178 | 0.800±0.366/0.783 (0.740) | 7.446 | 3.486±2.634/2.699 (2.184) | ||
A–F2 | 1.441 | 0.472 | 3.6 | |||||
A–F3 | 0.91 | 0.448 | 1.091 | |||||
A–F4 | 1.447 | 1.104 | 1.808 | |||||
A–F5 | 1.225 | 1.188 | 7.456 | |||||
A–F6 | 1.431 | 0.462 | 3.59 | |||||
A–F7 | 0.92 | 0.458 | 1.101 | |||||
A–F8 | 1.437 | 1.094 | 1.798 | |||||
A+F1 | 2.293 | 2.647±0.879/2.257 (2.055) | 1.139 | 1.300±0.372/1.265 (0.957) | 4.647 | 6.05±5.489/3.751 (12.870) | ||
A+F2 | 2.009 | 0.868 | 14.784 | |||||
A+F3 | 2.22 | 1.381 | 2.845 | |||||
A+F4 | 4.064 | 1.815 | 1.924 | |||||
A+F5 | 2.308 | 1.149 | 4.657 | |||||
A+F6 | 2.019 | 0.858 | 14.774 | |||||
A+F7 | 2.21 | 1.391 | 2.855 | |||||
A+F8 | 4.054 | 1.805 | 1.914 | |||||
A–P1 | 1.223 | 1.692±0.923/1.304 (2.184) | 0.808 | 0.799±0.083/0.812 (0.227) | 1.971 | 1.492±0.830/1.426 (1.911) | ||
A–P2 | 1.384 | 0.899 | 0.602 | |||||
A–P3 | 0.999 | 0.806 | 0.89 | |||||
A–P4 | 3.163 | 0.682 | 2.503 | 28.722‡ | 0.000‡ | |||
A–P5 | 1.233 | 0.818 | 1.961 | |||||
A–P6 | 1.374 | 0.889 | 0.612 | |||||
A–P7 | 0.989 | 0.816 | 0.88 | |||||
A–P8 | 3.173 | 0.672 | 2.513 | |||||
A+P1 | 2.288 | 1.813±0.571/1.859 (1.240) | 1.483 | 1.212±0.226/1.188 (0.512) | 19.697 | 8.137±7.421/5.852 (18.549) | ||
A+P2 | 2.386 | 1.034 | 5.827 | |||||
A+P3 | 1.146 | 1.341 | 5.877 | |||||
A+P4 | 1.43 | 0.991 | 1.148 | |||||
A+P5 | 2.298 | 1.493 | 19.687 | |||||
A+P6 | 2.376 | 1.024 | 5.837 | |||||
A+P7 | 1.156 | 1.351 | 5.867 | |||||
A+P8 | 1.42 | 0.981 | 1.158 |
Grps—groups; C—control; L—laparotomy; A—anastomosis; A-F—A-fusidic acid; A+F—A+fusidic acid; A-P—A-propolis; A+P—A+propolis; NCL—nucleolin; NPM1—nucleophosmin; UBTF—upstream binding transcription factor; SD—standard deviation;
* —NCL; †—NPM1;
‡—UBTF
Table 3. Binary comparison of the groups for NCL, NPM1 and UBTF
Groups | C | L | A | A–F | A+F | A–P | A+P | ||||||||
---|---|---|---|---|---|---|---|---|---|---|---|---|---|---|---|
NCL | χ2 | p | χ2 | p | χ2 | p | χ2 | p | χ2 | p | χ2 | p | χ2 | p | |
C | – | – | 6.353 | 0.012 | 1.588 | 0.208 | 0.706 | 0.401 | 11.294 | 0.001 | 1.103 | 0.294 | 4.412 | 0.036 | |
L | 6.353 | 0.012 | – | – | 2.824 | 0.093 | 2.824 | 0.093 | 1.335 | 0.248 | 0.176 | 0.674 | 0.000 | 1.000 | |
A | 1.588 | 0.208 | 2.824 | 0.093 | – | – | 0.893 | 0.345 | 11.294 | 0.001 | 0.099 | 0.753 | 1.588 | 0.208 | |
A–F | 0.706 | 0.401 | 2.824 | 0.093 | 0.893 | 0.345 | – | – | 11.294 | 0.001 | 0.335 | 0.563 | 1.929 | 0.165 | |
A+F | 11.294 | 0.001 | 1.335 | 0.248 | 11.294 | 0.001 | 11.294 | 0.001 | – | – | 4.412 | 0.036 | 1.335 | 0.248 | |
A–P | 1.103 | 0.294 | 0.176 | 0.674 | 0.099 | 0.753 | 0.335 | 0.563 | 4.412 | 0.036 | – | – | 0.706 | 0.401 | |
A+P | 4.412 | 0.036 | 0.000 | 1.000 | 1.588 | 0.208 | 1.929 | 0.165 | 1.335 | 0.248 | 0.706 | 0.401 | – | – | |
Groups | C | L | A | A–F | A+F | A–P | A+P | ||||||||
NPM1 | χ2 | p | χ2 | p | χ2 | p | χ2 | p | χ2 | p | χ2 | p | χ2 | p | |
C | – | – | 2.824 | 0.093 | 0.706 | 0.401 | 1.864 | 0.172 | 0.706 | 0.401 | 0.176 | 0.674 | 0.706 | 0.401 | |
L | 2.824 | 0.093 | – | – | 4.412 | 0.036 | 0.276 | 0.600 | 4.412 | 0.036 | 0.099 | 0.753 | 6.353 | 0.012 | |
A | 0.706 | 0.401 | 4.412 | 0.036 | – | – | 2.824 | 0.093 | 0.706 | 0.401 | 4.412 | 0.036 | 0.706 | 0.401 | |
A–F | 1.864 | 0.172 | 0.276 | 0.600 | 2.824 | 0.093 | – | – | 4.412 | 0.036 | 0.214 | 0.643 | 3.429 | 0.064 | |
A+F | 0.706 | 0.401 | 4.412 | 0.036 | 0.706 | 0.401 | 4.412 | 0.036 | – | – | 8.647 | 0.003 | 0.176 | 0.674 | |
A–P | 0.176 | 0.674 | 0.099 | 0.753 | 4.412 | 0.036 | 0.214 | 0.643 | 8.647 | 0.003 | – | – | 11.294 | 0.001 | |
A+P | 0.706 | 0.401 | 6.353 | 0.012 | 0.706 | 0.401 | 3.429 | 0.064 | 0.176 | 0.674 | 11.294 | 0.001 | – | – | |
Groups | C | L | A | A–F | A+F | A–P | A+P | ||||||||
UBTF | χ2 | p | χ2 | p | χ2 | p | χ2 | p | χ2 | p | χ2 | p | χ2 | p | |
C | – | – | 11.294 | 0.001 | 8.647 | 0.003 | 2.824 | 0.093 | 6.353 | 0.012 | 0.176 | 0.674 | 6.353 | 0.012 | |
L | 11.294 | 0.001 | – | – | 8.647 | 0.003 | 8.647 | 0.003 | 4.412 | 0.036 | 11.294 | 0.001 | 0.706 | 0.401 | |
A | 8.647 | 0.003 | 8.647 | 0.003 | – | – | 0.706 | 0.401 | 0.000 | 1.000 | 11.294 | 0.001 | 0.706 | 0.401 | |
A–F | 2.824 | 0.093 | 8.647 | 0.003 | 0.706 | 0.401 | – | – | 1.588 | 0.208 | 3.429 | 0.064 | 1.339 | 0.247 | |
A+F | 6.353 | 0.012 | 4.412 | 0.036 | 0.000 | 1.000 | 1.588 | 0.208 | – | – | 6.353 | 0.012 | 0.706 | 0.401 | |
A–P | 0.176 | 0.674 | 11.294 | 0.001 | 11.294 | 0.001 | 3.429 | 0.064 | 6.353 | 0.012 | – | – | 6.353 | 0.012 | |
A+P | 6.353 | 0.012 | 0.706 | 0.401 | 0.706 | 0.401 | 1.339 | 0.247 | 0.706 | 0.401 | 6.353 | 0.012 | – | – |
C—control; L—laparotomy; A—anastomosis; A–F—A–fusidic acid; A+F—A+fusidic acid; A–P—A–propolis; A+P—A+propolis; NCL—nucleolin; NPM1—nucleophosmin; UBTF—upstream binding transcription factor; numbers in bold show those with a statistically significant difference between these groups
Table 4. Double comparison of the groups for haemogram parameters
C vs L | C vs A | C vs A–F | C vs A+F | C vs A–P | C vs A+P | L vs A | L vs A–F | L vs A+F | L vs A–P | L vs A+P | A vs A–F | A vs A+F | A vs A–P | A vs A+P | A–F vs A+F | A–F vs A–P | A–F vs A+P | A+F vs A–P | A+F vs A+P | A–P vs A+P | |
---|---|---|---|---|---|---|---|---|---|---|---|---|---|---|---|---|---|---|---|---|---|
WBC | 11.294/0.001 | 0.176/0.674 | 3.188/0.074 | 5.835/0.016 | 4.412/0.036 | 1.588/0.208 | 11.294/0.001 | 8.647/0.003 | 4.412/0.036 | 2.824/0.093 | 6.353/0.012 | 0.176/0.674 | 6.353/0.012 | 2.824/0.093 | 2.482/0.115 | 4.412/0.036 | 4.412/0.036 | 0.893/0.345 | 0.176/0.674 | 0.099/0.753 | 0.000/1.000 |
NE | 11.294/0.001 | 6.353/0.012 | 2.482/0.115 | 11.294/0.001 | 11.294/0.001 | 2.824/0.093 | 4.864/0.027 | 11.294/0.001 | 1.588/0.208 | 5.354/0.021 | 8.647/0.003 | 1.588/0.208 | 4.412/0.036 | 1.864/0.172 | 0.176/0.674 | 8.353/0.004 | 6.353/0.012 | 0.706/0.401 | 0.798/0.372 | 2.824/0.093 | 1.588/0.208 |
LY | 8.647/0.003 | 0.044/0.833 | 2.824/0.093 | 4.412/0.036 | 4.412/0.036 | 0.176/0.674 | 11.294/0.001 | 9.956/0.002 | 6.353/0.012 | 4.412/0.036 | 10.599/0.001 | 1.588/0.208 | 1.335/0.248 | 1.588/0.208 | 0.176/0.674 | 0.706/0.401 | 0.176/0.674 | 0.397/0.529 | 1.588/0.208 | 0.000/1.000 | 0.798/0.372 |
MO | 4.642/0.031 | 1.588/0.208 | 1.588/0.208 | 11.294/0.001 | 8.647/0.003 | 2.824/0.093 | 0.621/0.431 | 2.824/0.093 | 2.824/0.093 | 1.864/0.172 | 1.588/0.208 | 0.706/0.401 | 6.353/0.012 | 3.982/0.046 | 2.824/0.093 | 8.353/0.004 | 6.353/0.012 | 1.588/0.208 | 0.398/0.528 | 0.003/0.958 | 0.000/1.000 |
EO | 2.031/0.154 | 0.804/0.370 | 2.049/0.152 | 6.362/0.012 | 0.471/0.493 | 0.177/0.674 | 3.192/0.074 | 5.869/0.015 | 1.864/0.172 | 2.832/0.092 | 0.997/0.318 | 0.011/0.915 | 6.381/0.012 | 0.225/0.635 | 0.714/0.398 | 8.998/0.003 | 0.025/0.874 | 2.194/0.139 | 3.982/0.046 | 5.592/0.018 | 0.398/0.528 |
BA | 7.468/0.006 | 8.453/0.004 | 4.587/0.032 | 10.774/0.001 | 7.290/0.007 | 3.418/0.064 | 4.263/0.039 | 0.012/0.913 | 4.153/0.042 | 0.740/0.390 | 1.240/0.266 | 4.915/0.027 | 3.235/0.072 | 2.522/0.112 | 2.031/0.154 | 2.557/0.110 | 0.821/0.365 | 0.908/0.341 | 0.138/0.711 | 0.026/0.872 | 0.044/0.833 |
NE(%) | 6.109/0.013 | 4.431/0.035 | 1.591/0.207 | 8.673/0.003 | 6.362/0.012 | 4.418/0.036 | 0.623/0.430 | 7.478/0.006 | 1.591/0.207 | 0.176/0.674 | 0.706/0.401 | 11.327/0.001 | 0.624/0.430 | 0.708/0.400 | 4.425/0.035 | 11.311/0.001 | 6.353/0.012 | 4.412/0.036 | 1.591/0.207 | 8.660/0.030 | 1.106/0.293 |
LY(%) | 0.540/0.462 | 1.864/0.172 | 0.044/0.834 | 8.647/0.003 | 8.040/0.005 | 8.647/0.003 | 2.168/0.141 | 0.100/0.752 | 9.276/0.002 | 10.599/0.001 | 11.294/0.001 | 2.482/0.115 | 1.588/0.208 | 1.864/0.172 | 3.188/0.074 | 8.972/0.003 | 9.276/0.002 | 11.294/0.001 | 3.188/0.074 | 0.000/1.000 | 3.197/0.074 |
MO(%) | 3.987/0.046 | 0.099/0.753 | 0.000/1.000 | 6.353/0.012 | 4.642/0.031 | 8.647/0.003 | 1.591/0.207 | 6.362/0.012 | 8.666/0.003 | 9.289/0.002 | 11.311/0.001 | 0.176/0.674 | 4.200/0.040 | 3.982/0.046 | 6.353/0.012 | 6.353/0.012 | 6.353/0.012 | 11.294/0.001 | 0.025/0.875 | 1.588/0.208 | 2.654/0.103 |
EO(%) | 0.399/0.527 | 2.840/0.092 | 5.394/0.020 | 1.869/0.172 | 3.786/0.052 | 0.177/0.674 | 0.623/0.430 | 1.232/0.267 | 2.168/0.141 | 1.736/0.188 | 0.896/0.344 | 0.814/0.367 | 2.832/0.092 | 0.805/0.370 | 1.335/0.248 | 4.231/0.040 | 0.045/0.833 | 2.853/0.091 | 5.843/0.016 | 1.106/0.293 | 3.786/0.052 |
BA (%) | 0.345/0.557 | 11.480/0.001 | 1.390/0.238 | 5.843/0.019 | 2.608/0.106 | 3.866/0.049 | 11.514/0.001 | 4.422/0.035 | 8.185/0.004 | 5.483/0.019 | 6.790/0.009 | 11.429/0.001 | 11.074/0.001 | 11.446/0.001 | 8.112/0.004 | 2.534/0.111 | 0.283/0.595 | 1.124/0.289 | 1.150/0.283 | 0.011/0.915 | 0.559/0.455 |
RBC | 8.052/0.005 | 11.311/0.001 | 8.052/0.005 | 1.108/0.293 | 0.707/0.400 | 10.290/0.001 | 9.926/0.002 | 0.276/0.600 | 3.574/0.059 | 5.338/0.021 | 2.482/0.115 | 4.864/0.027 | 11.294/0.001 | 11.294/0.001 | 6.353/0.012 | 3.383/0.066 | 6.353/0.012 | 0.334/0.563 | 0.893/0.345 | 6.630/0.010 | 8.647/0.003 |
HB | 4.893/0.027 | 11.327/0.001 | 4.886/0.027 | 0.544/0.461 | 2.194/0.139 | 8.673/0.003 | 8.998/0.003 | 0.003/0.958 | 2.489/0.115 | 4.878/0.027 | 1.869/0.172 | 8.076/0.004 | 11.294/0.001 | 11.294/0.001 | 2.496/0.114 | 2.485/0.115 | 3.589/0.058 | 2.022/0.155 | 0.011/0.916 | 6.630/0.010 | 8.353/0.004 |
HCT | 0.621/0.431 | 6.893/0.009 | 1.335/0.248 | 0.893/0.345 | 2.168/0.141 | 0.099/0.753 | 9.276/0.002 | 3.007/0.083 | 0.069/0.793 | 2.322/0.128 | 2.165/0.141 | 4.412/0.036 | 10.599/0.001 | 11.294/0.001 | 8.366/0.004 | 2.482/0.115 | 8.040/0.005 | 0.136/0.713 | 1.461/0.227 | 1.591/0.207 | 8.660/0.003 |
MCV | 8.647/0.003 | 2.842/0.115 | 2.824/0.092 | 6.100/0.014 | 9.956/0.002 | 11.294/0.001 | 3.007/0.083 | 4.412/0.036 | 2.824/0.093 | 1.726/0.189 | 1.461/0.227 | 0.467/0.495 | 1.106/0.293 | 0.044/0.833 | 4.412/0.036 | 0.334/0.563 | 0.135/0.713 | 9.956/0.002 | 1.335/0.248 | 6.100/0.014 | 4.412/0.036 |
MCH | 1.116/0.291 | 1.478/0.224 | 0.045/0.831 | 0.404/0.525 | 5.608/0.018 | 1.731/0.188 | 0.011/0.916 | 0.229/0.632 | 1.903/0.168 | 3.034/0.082 | 0.543/0.461 | 0.546/0.460 | 1.135/0.287 | 4.219/0.040 | 0.802/0.371 | 0.000/1.000 | 3.216/0.713 | 1.595/0.207 | 8.776/0.003 | 1.883/0.170 | 0.277/0.598 |
MCHC | 6.353/0.012 | 5.354/0.021 | 2.832/0.092 | 10.960/0.001 | 9.956/0.002 | 11.294/0.001 | 1.588/0.208 | 3.383/0.066 | 2.654/0.103 | 0.893/0.345 | 0.000/1.000 | 0.708/0.400 | 2.168/0.141 | 2.168/0.141 | 6.353/0.012 | 3.197/0.074 | 6.630/0.010 | 8.353/0.004 | 1.869/0.172 | 4.684/0.027 | 0.798/0.372 |
RDW(%) | 10.000/0.002 | 11.327/0.001 | 9.985/0.002 | 3.197/0.074 | 7.500/0.006 | 11.327/0.001 | 0.895/0.344 | 3.589/0.058 | 1.591/0.207 | 1.108/0.293 | 1.225/0.268 | 8.972/0.003 | 6.353/0.012 | 4.412/0.036 | 0.398/0.528 | 0.467/0.495 | 0.468/0.494 | 7.478/0.006 | 0.135/0.713 | 6.353/0.012 | 2.654/0.103 |
RDW | 8.647/0.003 | 11.294/0.001 | 8.647/0.003 | 8.040/0.005 | 6.353/0.012 | 11.294/0.001 | 0.000/1.000 | 3.584/0.058 | 2.168/0.141 | 0.621/0.431 | 0.176/0.674 | 4.412/0.036 | 2.824/0.093 | 1.588/0.208 | 0.000/1.000 | 0.176/0.674 | 0.003/0.958 | 10.599/0.001 | 0.176/0.674 | 6.353/0.012 | 2.824/0.093 |
PLT | 11.294/0.001 | 6.353/0.012 | 0.540/0.462 | 11.294/0.001 | 11.294/0.001 | 11.313/0.001 | 0.000/1.000 | 8.647/0.003 | 0.706/0.401 | 0.000/1.000 | 6.362/0.012 | 2.824/0.930 | 0.011/0.916 | 0.176/0.674 | 2.828/0.093 | 6.353/0.012 | 6.353/0.012 | 11.311/0.001 | 0.099/0.753 | 2.828/0.093 | 0.895/0.344 |
MPV | 1.114/0.291 | 0.623/0.430 | 4.231/0.040 | 4.444/0.035 | 3.048/0.081 | 0.626/0.429 | 0.069/0.792 | 5.852/0.016 | 1.731/0.188 | 0.627/0.429 | 1.869/0.172 | 4.005/0.045 | 0.710/0.399 | 0.177/0.674 | 1.736/0.188 | 9.956/0.002 | 9.970/0.002 | 0.710/0.399 | 0.547/0.460 | 4.893/0.027 | 3.589/0.058 |
PDW | 2.234/0.135 | 4.471/0.034 | 0.476/0.490 | 0.045/0.832 | 0.182/0.670 | 3.665/0.056 | 9.400/0.002 | 4.545/0.033 | 0.727/0.394 | 1.130/0.288 | 10.135/0.001 | 2.375/0.123 | 3.052/0.081 | 0.905/0.341 | 0.102/0.750 | 0.912/0.340 | 0.102/0.750 | 2.043/0.153 | 0.011/0.916 | 3.230/0.072 | 0.548/0.459 |
PCT | 10.275/0.001 | 2.654/0.103 | 0.893/0.345 | 8.647/0.003 | 8.647/0.003 | 11.311/0.001 | 1.103/0.294 | 0.000/1.000 | 2.824/0.093 | 0.706/0.401 | 11.311/0.001 | 0.176/0.674 | 0.706/0.401 | 0.706/0.401 | 3.192/0.074 | 6.353/0.012 | 0.706/0.401 | 9.941/0.002 | 1.588/0.208 | 0.398/0.528 | 8.660/0.003 |
C—control; L—laparotomy; A—anastomosis; A-F—A-fusidic acid; A+F: A+fusidic acid; A-P—A-propolis; A+P—A+propolis; WBC—white blood cells; NE—neutrophil; LY—lymphocytes; MO—monocytes; EO—eosinophil; BA—basophil; RBC—red blood cells; HB—haemoglobin; HCT—haematocrit; MCV—mean corpuscular volume; MCH—mean corpuscular haemoglobin; MCHC—MCH concentration; RDW—red cell distribution width; PLT—platelets; MPV—mean platelet volume; PDW—platelet distribution width; PCT—procalcitonin
Table 5. Model summary and parameter estimates for expression levels of NCL, NPM1 and UBTF
Variable | Equation | Model summary | Parameter estimates | |||||||
---|---|---|---|---|---|---|---|---|---|---|
R2 | F | df1 | df2 | sig | Constant | b1 | b2 | b3 | ||
NCL and NPM1 | Linear | 0.157 | 10.048 | 1 | 54 | 0.003 | 0.652 | 0.210 | ||
Log | 0.182 | 12.018 | 1 | 54 | 0.001 | 0.839 | 0.394 | |||
Cubic | 0.337 | 8.822 | 3 | 52 | 0.000 | –1.204 | 3.439 | –1.601 | 0.230 | |
NCL and UBTF | Linear | 0.019 | 1.068 | 1 | 54 | 0.306 | 3.539 | 0.973 | ||
Log | 0.028 | 1.579 | 1 | 54 | 0.214 | 4.311 | 2.045 | |||
Cubic | 0.152 | 3.118 | 3 | 52 | 0.034 | 13.320 | –19.886 | 12.261 | –2.008 | |
NPM1 and UBTF | Linear | 0.019 | 1.059 | 1 | 54 | 0.308 | 6.985 | –1.823 | ||
Log | 0.055 | 3.139 | 1 | 54 | 0.082 | 4.911 | –2.559 | |||
Cubic | 0.244 | 5.601 | 3 | 52 | 0.002 | 26.984 | –76.172 | 76.688 | –23.069 |
NCL—nucleolin; NPM1—nucleophosmin; UBTF—upstream binding transcription factor
The mean±SD/median (range) haemogram values for each group are available from the authors on request.
When we performed the polynomial regression analysis, a statistically significant relationship between NCL expression levels and both NPM1 and UBTF expression levels were detected (p<0.05). Additionally, a statistically significant relationship between NPM1 and UBTF was detected (p<0.05) (Fig 1).
When the expression levels of the related genes and blood parameters were considered, the relationship between NCL expression levels and: neutrophil (NE) count; NE(%); eosinophil (EO) count; EO(%); lymphocyte (LY) (%); haematocrit (HCT); mean corpuscular volume (MCV); red cell distribution width (RDW); RDW(%); platelets (PLT); platelet distribution width (PDW); and procalcitron (PCT) were statistically significant (p<0.05) (Fig 2a and 2b). Additionally, the relationship between NPM1 and LY, LY(%), EO, EO(%), MO(%), haemoglobin (HB), HCT and MCV were statistically significant (p<0.05) (Fig 3a and 3b). Also, the relationship between UBTF and NE, monocyte (MO) count, MO(%), red blood cells (RBC), HB, MCV and mean corpuscular haemoglobin concentration (MCHC) were statistically significant (p<0.05) (Fig 4a and 4b) (data supporting Figs 2–4 are available from the authors on request).


Discussion
Throughout history, honey has been viewed by physicians as an important medicine. Roman physicians stated that honey was a very powerful antidote; Hippocrates stated that honey was equivalent to air and water; Egyptian, Greek and Arab physicians also stated that honey was used in the form of syrup or ointment alone or mixed with herbs for various eye, spirit and nervous diseases.9
Propolis is a sticky substance that honey bees produce by mixing various substances they collect from plants with their own secretions. Honey bees use propolis for many purposes, such as to close the cracks in the hive, or to cover its inner surface, preventing the growth of bacteria, viruses and fungi.10 Propolis has epithelial, analgesic, antibacterial, antifungal and antiviral effects. Its side-effects are almost nonexistent. It has been reported that microbial resistance does not develop against propolis; of particular importance given the need to identify new therapeutic agents and markers that can be used in wound healing, preventing infection and sepsis.11
As a multifunctional nucleolar protein, NCL has an important role in chromatin structure, rDNA transcription, rRNA maturation, early stages of ribosome assembly and nucleocytoplasmic transport.
As an abundant nucleolar phosphoprotein, NPM1 has an important function in different cellular processes, such as nucleic acid binding,12 ribosome assembly,13 centrosome duplication,5 cytoplasmic nuclear shuttle transportation14 and cell proliferation.15 As one of the transcription factors, the UBTF is detected in the first cell cycle of zygotic embryos and has a crucial function for chromatin remodelling, the binding of RNA polymerase I to rDNA in ribosomal RNA transcription and pre-rRNA processing.16

Mammalian cell nucleoli consists of three internal phase-separated subcompartments: the FC, DFC and GC. The rRNA synthesis and initial ribosomal subunit maturation steps occur in the FC–DFC region. NPM1 has a central role in nucleolar structure and is predominantly placed in the GC.17
NORs are nucleolar organiser regions that also known rDNA in humans and other eukaryotes. There are NOR proteins (an indicator of cellular proliferation and activity) in the active zone of the nucleus (fibrillar and dense fibrillar centre). In the literature, there were studies regarding the protective effects of argyrophilic NOR (AgNOR) proteins against carbon monoxide intoxication (a cause of hypoxic conditions) in different tissues such as: rat myocardium;18 femoral muscle cells of rats exposed CO gas;19 lung tissues of rats;20 cytologic discrimination of benign and malign thyroid tissue;21 and follicular thyroid lesions;22 the detection of some substances' most reliable dose for cancer treatment such as rhamnetin23 and capsaicin in cancer treatments.24
In one study, an association between human hair loss and the expression levels of NCL, NPM1 and UBTF genes were reported.25 We could find no studies in the literature on the expression levels and function of NCL, NPM1 and UBTF in experimental clean and clean–contaminated laparotomy wound models, applied with or without propolis and fusidic acid. A statistically significant relationship between NCL expression levels and both NPM1 and UBTF expression levels were detected as well as between NPM1 and UBTF. It can be said that there are relationships between NCL, NPM1 and UBTF genes in cellular processes.
In addition to ribosome assembly, it was suggested that the nucleoli has an important role in preventing irreversible, pathological protein aggregation. Under different stress conditions, the nucleolus prevents potentially toxic aggregates from occurring. When different types of proteotoxic stress occur, such as heat shock, metastable and misfolded nuclear proteins are transiently accumulated in the GC region of the nucleolus, and interact with NPM1 and other different nucleolar proteins, to prevent coaggregation and refolding by protein chaperones, such as 70 70kDa heat shock proteins (HSP70) that accumulate in the nucleolus during stress.26

When the expression levels of the related genes and blood parameters were considered, there were statistically significant relationships, as shown in the Results section.
Since its discovery, many studies have been carried out on the complex structure of the nucleolus. The nucleolus contains proteins as products of a wide variety of genes, and its structure remains a focus for ongoing research. The nucleolus, which is the centre of ribosomal biogenesis, where many genes and gene products interact with each other and with other compartments of the cell, has an important function in maintaining cell homeostasis under various intrinsic and extrinsic conditions, such as stress and injury.27,28
Conclusion
The NCL, NPM1 and UBTF proteins have important functions for cell viability maintenance, and can be used as markers for the management of effective therapeutic strategies in clean and clean–contaminated laparotomy wounds. Additionally, propolis has positive benefits in wound healing and in the prevention of wound infection. We think that our findings provide insights into the putative role of those proteins in wound healing.


Reflective questions
- How can nucleolin (NCL), nucleophosmin (NPM1) and upstream binding transcription factor (UBTF) gene expression levels be used as alternative markers for the evaluation of wound healing?
- How can NCL, NPM1 and UBTF be used for the management of effective therapeutic strategies in clean and clean–contaminated laparotomy wounds?
- What are some of the benefits of propolis in wound healing?